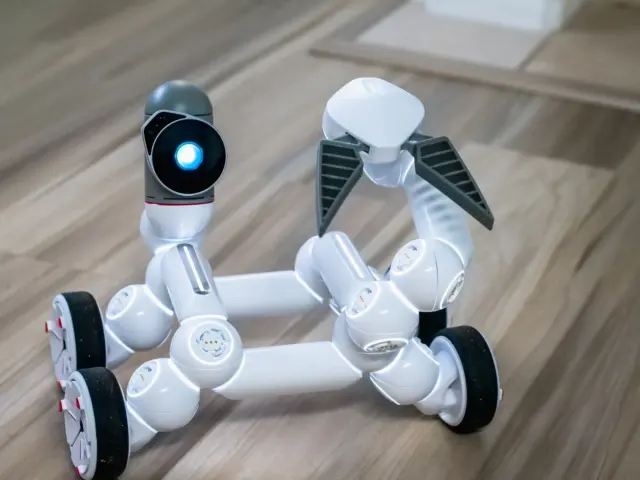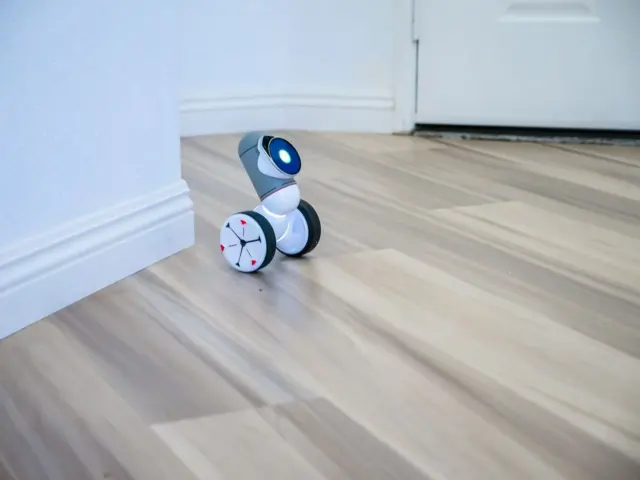

A robot at a doorway needs to know what is blocked. So what is an occupancy grid map? A grid of cells, each storing the probability that the cell is occupied by an obstacle.
This guide covers the data structure itself. For the full process of building one from sensor data, read how do robots map indoor environments. For the wider field, see indoor autonomous robots.
What an occupancy grid map actually stores
An occupancy grid map divides space into cells and stores, for each one, the probability that it is occupied, as Voxel51’s glossary describes it. It is not a photograph or a line drawing of walls. It is a table of numbers laid over the floor plan, and every number is a belief about one patch of space.
That distinction clears up several common misunderstandings. The table below sets the usual assumptions beside what the structure does.
| Common assumption | What the grid does | Planning use |
|---|---|---|
| A cell is either wall or not wall. | Each cell holds a probability of being occupied, commonly on a scale from 0 (free space) to 100 (100% likely occupied). | Treat mid-range values as uncertain, not as obstacles or free space. |
| Blank areas of the map are empty. | Cells no sensor has scanned are marked -1, or stay at their prior probability. | Do not route through unknown space as if it were confirmed free. |
| One scan overwrites the map. | Updates accumulate evidence across many readings, so noise averages out over time. | Expect cells to firm up as the robot revisits an area. |
| Finer cells are always better. | Finer cells capture more detail but cost more memory and computation. | Pick the coarsest cell size that still resolves the gaps the robot must pass. |
| A map is always a flat floor plan. | The grid can be two-dimensional for floor-plan navigation or three-dimensional for full volumes. | Choose by whether height matters to the task. |
Figures and behaviour here follow Automatic Addison’s occupancy grid explainer and Voxel51’s glossary.
Free, occupied and unknown cells
Free, occupied and unknown are three different states, and the third is the one most often misread. A cell’s number places it somewhere between confidently free and confidently occupied, or flags it as never observed.
Free space
Cells the sensors have seen through become confidently free. On the common scale, free space sits at 0. A free cell therefore records positive evidence that a sensor beam passed through it, not merely that nothing was detected there.
Occupied space
The scale often runs up to 100, meaning a cell is 100% likely occupied, according to Automatic Addison. Values between the two ends express partial confidence. A robot that treats every non-zero cell as a wall will be needlessly timid, while one that ignores intermediate values will occasionally clip a corner it only half-saw.
Unknown space
Conceptually, these are cells no sensor ray has observed, which stay at their prior probability, per Voxel51. Unknown is neither safe nor dangerous. It is the absence of evidence, and a planner should handle it by policy, for example exploring it or avoiding it, rather than by assuming it is free.
How scans update cell probabilities
A range sensor does not write walls onto the map directly. Each beam is traced through the grid, a step often called ray casting, and the cells along its path are adjusted. Every ray updates the cells it passes through, lowering their occupancy probability, and the cell where it terminates, raising it.
That rule gives a wall its characteristic signature. The cells in front of a surface drift toward free, and the cell at the surface drifts toward occupied. Cells behind the surface are never crossed by that beam, so they stay unknown, which is why a thin wall does not reveal what lies beyond it.
Why probabilities rather than hard marks
Real sensors are noisy. Bayesian updates accumulate evidence across many readings, so noise averages out over time. One stray reading nudges a cell’s value but does not decide it. This is the practical reason a grid is stored as probabilities: repeated agreeing observations push a cell firmly toward free or occupied, and conflicting ones keep it uncertain.
Which sensors feed the grid
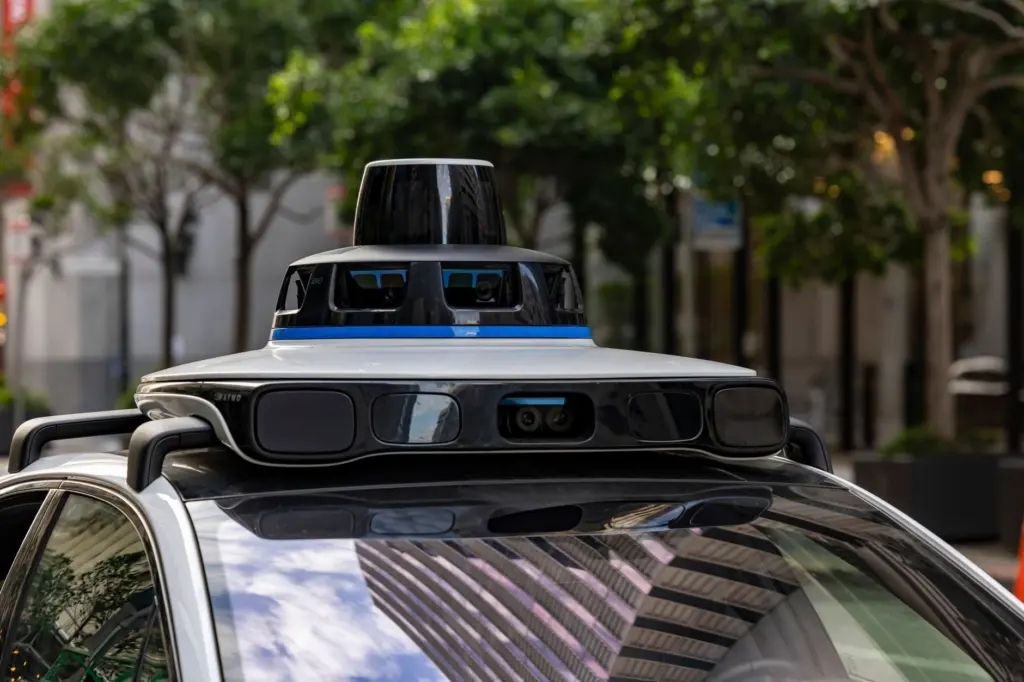
Lidar is the typical primary sensor. A paper on dynamic occupancy grids notes that these maps are typically generated primarily from lidar measurements. The structure itself does not depend on one sensor type, since any range measurement that can be traced as a ray can drive the same update.
Choosing a grid resolution
Resolution is the size of one cell, and it is the main tuning decision. Finer cells capture more detail but cost more memory and computation, as Voxel51 puts it. Coarser cells are cheaper to store and update but blur narrow gaps and thin obstacles.
Resolution also defines how positions convert to cells. In the example from Automatic Addison, with 0.1 m cells, a robot reporting its position as (3.5, 4.3) m corresponds to the grid location (35, 43). Position is measured relative to the map’s corner.
- Match the cell to the smallest gap that matters. If the robot must fit through doorways and between furniture, cells need to be fine enough to show those openings as free rather than merged into walls.
- Budget for the update cost. Every halving of cell size multiplies the cell count, and every cell is touched by rays, so memory and processing rise together on the same hardware.
- Prefer coarse for wide, open spaces. Large halls gain little from fine cells, so a coarser grid is usually the better trade there.
2D versus 3D occupancy maps
The grid can be two-dimensional for floor-plan navigation or three-dimensional for full volumes. The choice depends on whether the robot’s decisions depend on height.
2D floor-plan grids
A 2D grid is a plan view: each cell covers a patch of floor, and the stored probability summarises whether something blocks it. It suits wheeled robots moving across a level floor, because it is compact and cheap to update.
The limit of a plan view is that it flattens height. An overhanging shelf or a table top can matter to a robot even if the floor beneath it is clear, and a single 2D value per cell cannot separate the two.
3D volumetric grids
A 3D occupancy map applies the same probability idea to volumes, so each cell becomes a block of space. Readers following an OctoMap-style tutorial will meet the same free, occupied and unknown states, just stored per voxel instead of per floor cell. That suits drones, arms and any robot whose body or task extends upward.

The cost is that memory and computation grow with the extra dimension. For a robot that only drives on a level floor, a 3D grid adds expense without adding decisions, so a 2D grid is the sensible default there. Move to 3D when obstacles above or below the floor plane change where the robot can safely go.
How planners use the grid
Motion planners consume the grid directly for collision-free navigation. Planning tools often work from grid-based structures such as a costmap, which turns occupancy information into something a planner can score paths against. Whatever the planner does, it inherits the grid’s uncertainty: a path through cells of doubtful value is only as safe as the map beneath it.
Two practical points follow. First, resolution limits planning precision, because a planner cannot thread a gap the grid cannot represent. Second, unknown cells need an explicit rule. The algorithms that turn a grid into a route are covered in robot path planning algorithms.
Frequently asked questions
| Question | Answer |
|---|---|
| Can an occupancy grid represent moving objects? | A dynamic occupancy grid is a local map of the environment containing both static and dynamic information, according to a paper on dynamic occupancy grids. A plain grid records only occupancy probability per cell. |
| Does the sensor have to be lidar? | Lidar is the typical primary sensor, but the same paper describes radar as emerging as a viable alternative to lidar as the primary sensor for mapping. |
| Where does a grid’s coordinate system start? | A robot’s position is relative to the corner of the map, at x=0, y=0, as Automatic Addison explains, and the cell size converts that position into a cell location. |